The country’s total foreign trade turnover for January-August 2024 reached $42.7 billion, an increase of $2.66 billion, or 6.6%, compared to the same period last year. This growth was driven by both exports and imports, although the pace of import growth slowed compared to 2023, when trade turnover grew by 23.2% during the same eight months.
Gold Exports Boost Trade Figures
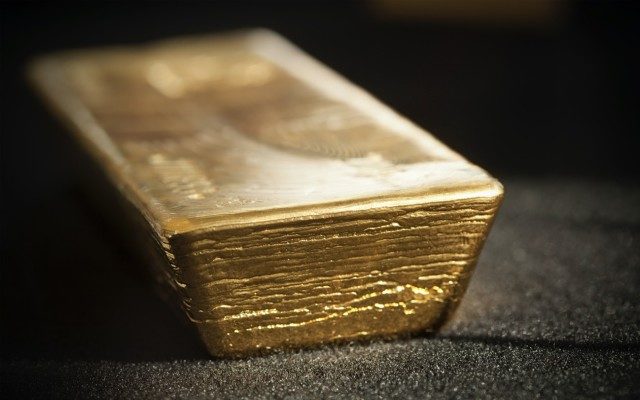
Gold played a crucial role in the 5.5% rise in exports, totaling $17.34 billion. However, this is a notable slowdown compared to the 27.8% increase in exports recorded in the same period last year. Gold exports for the first eight months of 2024 amounted to $4.99 billion, which is 11.5% lower than the $5.64 billion recorded during the same period in 2023.
The most recent sale of gold occurred in May, with $771.9 million worth of the metal exported. Prior to that, the country exported $758.3 million in April, $1.35 billion in March, and $1.32 billion in February. There were no gold exports in June and July, but August saw a resurgence with $792.6 million in sales.
Despite this, gold’s share of Uzbekistan’s total exports decreased from 34.3% (January-May) to 28.8%. Although the value of the country’s gold reserves increased due to rising global gold prices, the physical volume of these reserves declined slightly.
Energy and Commodities Trade
Uzbekistan also saw a notable increase in energy imports and exports. Over the first eight months of 2024, the country imported $1.42 billion worth of oil and oil products, a 29.5% increase from the same period in 2023. The bulk of these imports occurred in March and April, though August saw a dip to $117.9 million.
Oil product exports, on the other hand, surged by 2.3 times to reach $409.4 million, though there was a sharp decline in August to just $9.5 million, a 12-fold decrease compared to July’s $114.5 million.
Gas imports also surged, increasing 5.7 times to $1.15 billion, while gas exports began to recover after several months of decline, reaching $404.8 million, up 7.1%. Meanwhile, coal imports slowed, and electricity imports rose by 10.5% to $88 million, while electricity exports jumped by 45.8% to $70.4 million.
Textile and Agriculture Sectors
While energy exports showed mixed results, the textile industry saw a decline. Textile exports fell by 5.3% over eight months to $2 billion, driven by a drop in the export of finished textile products, knitwear, fabrics, and socks. The only area of growth in the textile sector was in yarn exports, which rose from $840.9 million to $897 million.
In contrast, Uzbekistan’s fruit and vegetable exports experienced strong growth, increasing by 20.8% in value to $922.8 million. The volume of exports also grew by 9% to 1.36 million tons. Russia remains the largest market for Uzbek fruits and vegetables, with its share rising from 42% to 44.1%. Other key markets include Pakistan, Kazakhstan, and Afghanistan.
Services Sector
The services sector also contributed significantly to the country’s export growth. Services exports increased by 25.4% to reach $4.4 billion, with tourism ($2.08 billion) and transportation ($1.64 billion) accounting for the largest portions. Gas transportation alone cost the country $425 million. On the import side, services increased by 9% to $2.3 billion, with $1.2 billion spent on tourism.

